
Systematic Research / 012008—2026
Trend following,
engineered for evidence.
A proprietary, long-only trend-following system for SPY and QQQ — developed in Python and researched in QuantConnect under transaction-cost-aware conditions.
Performance / 2008—2026
Long-horizon results.
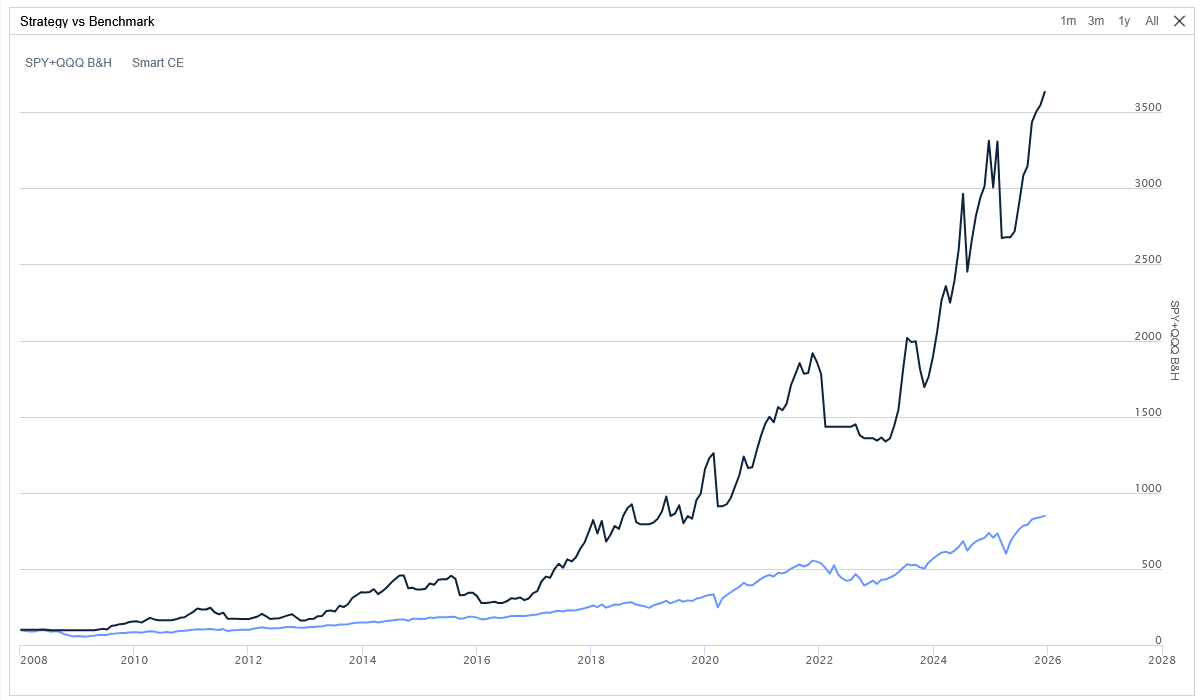
Results shown against an equal-weight SPY + QQQ buy-and-hold benchmark. Commissions and slippage are included.
Benchmark comparison
Participation without permanence.
The system is designed to participate in persistent upside trends while moving defensively when its decision rules no longer support exposure.
Its capital allocation is dynamic: the system concentrates more of the portfolio in the strongest, most persistent trends and keeps exposure deliberately smaller when a trend fails to develop. This structure limits the capital at risk in short-lived moves while allowing the largest allocations—and therefore the greatest profit potential—to remain focused on the market’s strongest and longest-running trends.
SPY + QQQ buy & holdSystem strategy
Research integrity / 02
Built to withstand scrutiny.
The objective is not to produce an attractive historical curve. It is to create a decision system whose assumptions, costs, and failure modes remain visible.
Bias-controlled design
Research logic is structured to eliminate common backtest distortions, including forward-looking information and discretionary hindsight.
Transaction-cost aware
Commission and slippage assumptions are included so reported results reflect executable conditions more closely.
Out-of-window checks
The complete 2008–2026 history is supplemented with separate 2016–2026 and 2020–2026 test windows.
Full trade evidence
Trade-by-trade exports, supporting ratios, benchmark comparisons, and drawdown records remain available in the repository.
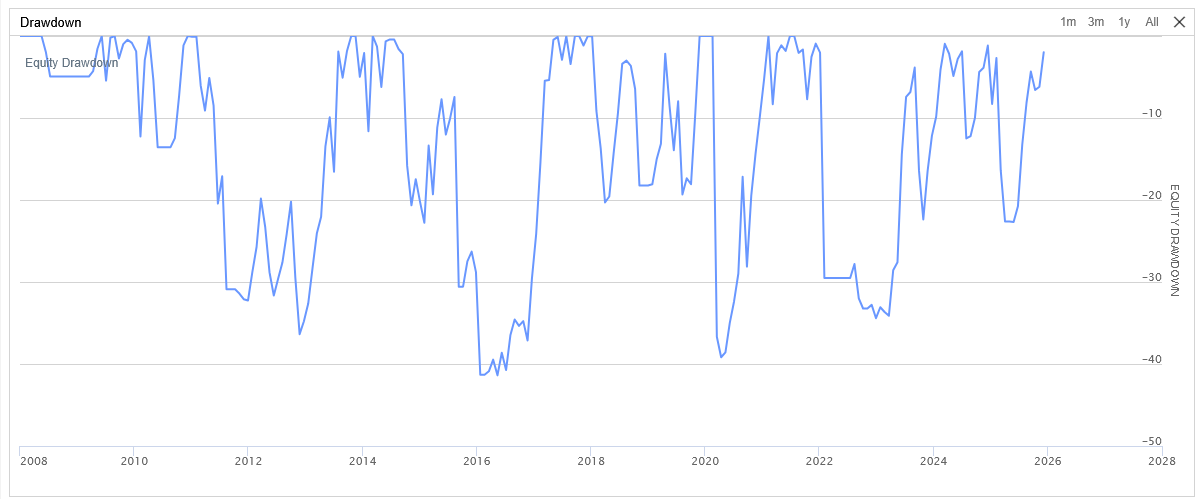
Drawdown profile
Risk is part of the result.
Trend-following returns are not linear. The drawdown record is published alongside performance to make the system’s path dependency and recovery burden explicit.
Complete evidenceInspect the system,
Inspect the system,
not only the headline.
The repository contains detailed performance statistics, benchmark comparisons, drawdown maps, additional test windows, and complete trade exports.
Open complete repository ↗Backtested performance is hypothetical and does not represent live trading results. Past performance does not guarantee future results. This material is provided for research and informational purposes only and is not investment advice.